

Austin Real Estate · August 2026 Market Report
What the August 2026 Data Actually Shows
Two months ago, Austin's market finally turned a corner — June and July both posted the first back-to-back annual price gains since the 2022 correction began. August broke that streak. The metro median fell 6.4% year-over-year, sales slowed, and the data points to something bigger than a local blip: national interest-rate pressure has caught up with Central Texas. Here’s what actually happened, and what it means if you’re shopping right now.
August 2026 Snapshot — Austin Board of Realtors / Unlock MLS & Team Price
| Metric | Figure | What it means |
|---|---|---|
| Metro median sold price | $412,000 ▼ 6.4% YoY | First pullback after two straight monthly gains |
| Active listings | 16,904 | Team Price tracking as of Sept. 2; still ample choice |
| Avg days on market | 69 days | Longest reading since early spring |
| Listings with price cuts | 55.43% | Good news for prepared buyers |
| Months of inventory | ~5.8 months | Loosening again after tightening through summer |
| Sold-to-list ratio | 97.28% | ~2.7% below ask, on average |
Two months of gains, then a pullback
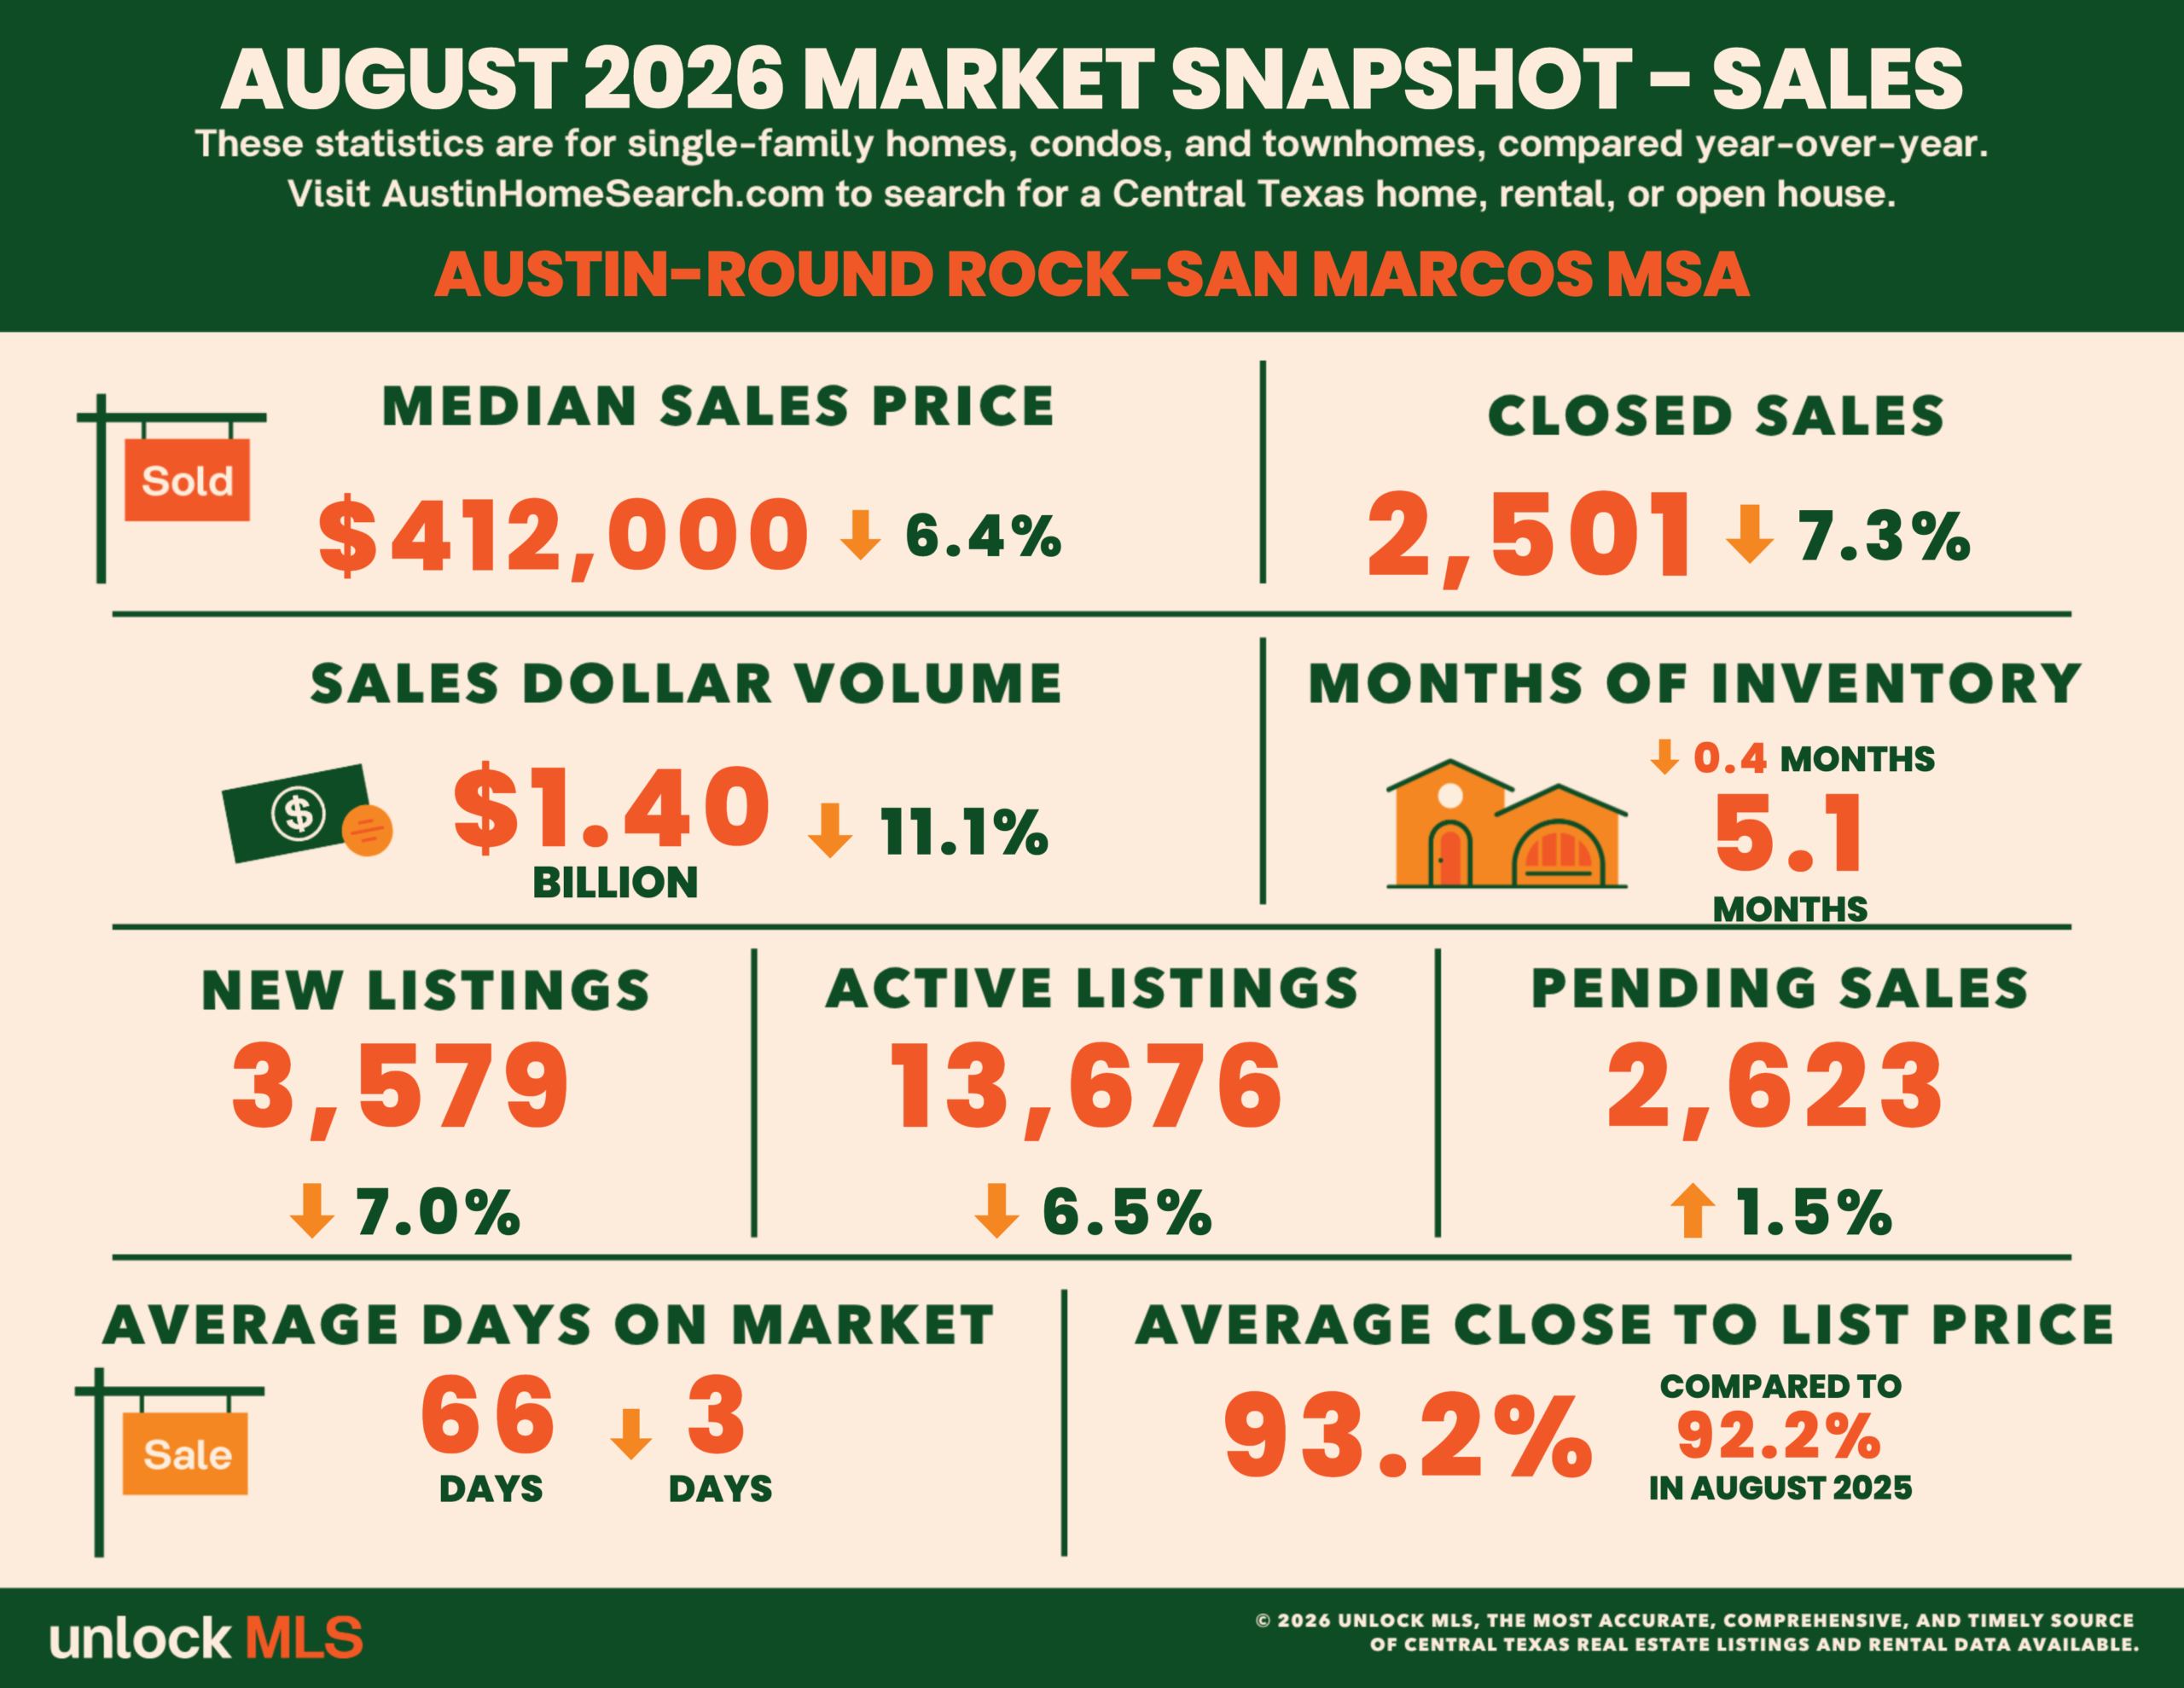
Austin's housing market peaked in May 2022 with a metro median sold price of around $550,000, then spent three years grinding through a correction. June and July 2026 briefly interrupted that pattern, each posting a modest year-over-year price gain for the first time since the correction began. August erased that streak: the metro median sold price fell 6.4% year-over-year to $412,000, according to the official Unlock MLS / ABoR report. Closed sales dropped 7.3% to 2,501, and total dollar volume across the metro fell 11.1% to roughly $1.4 billion.
Team Price’s independent daily tracking tells a similar story: their August median came in at a comparable $415,000, down 5.7% year-over-year and down $17,250 from July’s reading — and by their calculation, the metro sits about 24.6% below the May 2022 peak. Two sources, two different methodologies, and both point the same direction.
“Austin is not immune to what is happening across the rest of the country.”
— Vaike O’Grady, Market Research Advisor, Unlock MLS, September 2026
That framing matters. Austin's pullback isn’t a story about the city losing its appeal — it’s a story about mortgage rates climbing nationally and buyers everywhere pulling back a notch. Unlock MLS’s president, John Crowe, described the shift as a normal part of a changing market rather than a cause for alarm, and pointed to continued job growth and business investment across the region as the more durable signal underneath the monthly noise. One bright spot backs that up: pending sales across the metro still rose 1.5% year-over-year to 2,623 contracts, even as closed sales fell.
What 16,900 active listings actually means for you
There were 16,904 active residential listings across the Austin metro as of Team Price’s September 2 reading — a level that keeps real choice on the table for buyers. Of those, 55.43% have already had at least one price reduction, which means more than half the sellers currently on the market have already adjusted their expectations at least once since listing.
For context: in early 2022, Austin routinely had fewer than 2,000 active listings at any given time, and buyers had hours, not days, to decide. That market isn’t coming back this year. Today you can tour a home, sleep on the decision, order an inspection, and still make a competitive offer. The average listing spent 69 days on the market in early September, per Team Price’s tracking — among the longer readings of the year so far, and exactly the kind of number that gives a prepared buyer real room to operate.
Kevin’s take
Close to 5.8 months of inventory is right around balanced, and a 55.43% price-reduction rate tells you a lot of sellers are still catching up to where the market actually is. That gap is your opening. The homes priced correctly from day one are still moving quickly — Austin’s single-family market showed a 21-day median sale in the fastest price bracket this month — while the ones that aren’t are sitting well past 60 days. Those sellers are the ones with real room to negotiate.
Prices by area: the market is not one market
The metro median doesn’t tell you much about what you’ll actually experience on the ground. Inside the City of Austin, the median sold price fell 4.3% year-over-year to $560,000, with sales down 10.3% to 844 homes. Every major county in the report posted lower sales and softer prices than a year earlier — with one small exception.
County breakdown — August 2026, ABoR / Unlock MLS
| Area | Median price | Inventory | Conditions |
|---|---|---|---|
| City of Austin | $560K ▼ 4.3% | 4.6 mo Balanced | 844 closed sales, down 10.3% YoY |
| Williamson County | $399.9K ▼ 5.9% | 4.6 mo Balanced | Pending sales still positive, up 9.3% YoY |
| Travis County | $489K ▼ 6.4% | 5.1 mo Balanced | 1,111 closed sales, down 9.5% YoY |
| Hays County | $355K ▼ 1.4% | 5.5 mo Balanced | Smallest decline of the major counties |
| Bastrop County | $342.5K ▼ 5.1% | 7.4 mo High | Deepest inventory among the larger counties |
| Caldwell County | $270K ▲ 17.4% | 7.3 mo High | This month’s lone gainer, but a small sample |
Caldwell County is the outlier worth a second look: sales rose 24.2% and the median price jumped 17.4% to $270,000. It’s the most affordable county in the metro by a wide margin, and its small transaction volume means a handful of unusual closings can swing the numbers more than they would in Travis or Williamson. Everywhere else, the story is the same shape as the metro as a whole — softer prices, fewer sales, and inventory that eased or grew rather than tightened.
The rates question everyone’s asking
Mortgage rates climbed through late summer, with Freddie Mac’s 30-year fixed average reaching 6.76% as of September 10, 2026 — up from 6.66% in late August and 6.35% a year earlier. That climb is a big part of why August cooled: higher payments mean fewer qualified buyers, even in a market with real demand underneath it. But 6.76% isn’t historically unusual; it’s only unusual compared to the pandemic-era lows of 2021, which were the anomaly, not the baseline.
The phrase still holds: date the rate, marry the house. Buy the right home now, while prices have pulled back and sellers are motivated, and refinance later if rates ease. You can’t go back and buy today’s home at today’s price in a future year — but you can absolutely refinance a 2026 purchase into a lower rate down the line if one shows up.
Buyer activity: two sources, two slightly different reads
Here’s where it gets interesting. ABoR’s official MLS-only report shows metro-wide pending sales up 1.5% year-over-year to 2,623 contracts in August — a real, if modest, demand signal. Team Price’s broader daily tracking, which pulls in new construction and a wider set of sources, tells a more cautious story: as of mid-September, pending listings stood at 3,823, down 5.3% from 4,038 a year ago, and their Activity Index had fallen to 18.1% from 19.1%, placing the metro in what they classify as a “Contraction” band.
Both readings can be true at once. The narrower, MLS-only pending count that feeds ABoR’s official report is still positive. The broader, faster-moving tracking that includes new construction is showing more near-term softness. For a buyer, the practical takeaway is the same either way: nobody’s in a rush right now, and that’s exactly the condition that favors a patient, well-prepared offer.
What to expect in the negotiation
The sold-to-list ratio of 97.28% confirms that final sale prices are running close to 2.7% below the last asking price on average — on a $500,000 list price, that works out to roughly $13,600 in typical negotiated room, per Team Price’s tracking. But the more revealing number is what happens to sellers who launch high and then reduce. Austin’s single-family market posted an average close-price-to-original-list-price ratio of 93.53% in August, against an average close-price-to-most-recent-list-price ratio of 97.08% — a 3.55-point gap. Applied to the City of Austin’s roughly $640,000 median original list price, that gap works out to about $32,000 left on the table by the seller who guessed too high at launch.
In practical terms: the homes worth targeting are the ones that have already sat 45 to 60 days or more with at least one price cut behind them. Those sellers have recalibrated and know where the market actually is. That’s where your leverage is concentrated right now — on inspections, repairs, closing costs, and rate buydowns, not necessarily a further haircut off an already-adjusted price.
Practical buyer checklist
- Before you start touring: Get fully pre-approved, not just pre-qualified. With rates near 6.76%, lenders are underwriting more carefully, and a strong pre-approval carries real weight with sellers.
- When you’re searching: Prioritize homes 45+ days on market with at least one price reduction. Check listing history on Zillow or Realtor.com to understand where a seller’s expectations actually sit.
- On the offer: Ask for a rate buydown, a closing cost contribution, or a home warranty — not just a further price cut. With rates elevated, a buydown often moves a seller more easily than the same dollar amount off the price.
- On the inspection: Get a thorough one. Buyers still have full inspection rights in most Austin transactions. Foundation, roof age, HVAC condition, and flood zone status are the four non-negotiables — check FEMA’s flood map before you fall in love with a property.
- On property tax: Travis County averages roughly 2.1% annually. On a $412,000 home that’s about $721/month on top of your mortgage. Model the full monthly cost before you commit to a price point.
My honest assessment
I’ve watched this market through every phase — the frenzy, the correction, June and July’s brief turn upward, and now August’s pullback. Here’s what I’d tell a close friend right now.
If you plan to stay in Austin for at least three to five years, August actually reopened a window that looked like it might be narrowing back in July. Prices eased, more than half of active listings have already cut price at least once, and mortgage rates — while higher than they were earlier this summer — haven’t stopped buyers from writing offers; pending sales are still positive. The city’s underlying fundamentals, the tech and biotech employment base, the population growth, haven’t changed. What’s changed is that national rate pressure gave patient buyers a little more room to work with than they had a month ago.
If you’re buying to flip in six months, this still isn’t your market. A slower, longer sales cycle works against a short holding period no matter which direction prices are moving.
If you’ve been waiting for rates to come down before you buy, I’d push back gently: nobody knows when that happens, and every month you wait is a month you’re not building equity. August gave buyers more negotiating room on price than they’ve had since early summer. That trade-off — a softer price against a firmer rate — is one worth running the actual numbers on with a lender, rather than guessing.
Ready for a personalized breakdown?
A free market report with current comps, neighborhood inventory data, and a clear picture of what your budget gets you in today’s Austin. No pressure, no obligation.
Get my free buyer report →Data sources
Austin Board of Realtors / Unlock MLS · August 2026 Central Texas Housing Report · Team Price Austin Daily Real Estate Briefing · Team Price Market Update · Austin Real Estate Homes Blog, Eleven Oaks Realty · Freddie Mac Primary Mortgage Market Survey. All data reflects August 2026 activity as reported through mid-September 2026. Market statistics are deemed reliable but not guaranteed, and figures from different providers may use different methodologies or geographic scope. Kevin McAfee is a licensed Texas REALTOR® with Vista Realty Group.
